 |
Simulation Post-Processing |
Capabilities
|
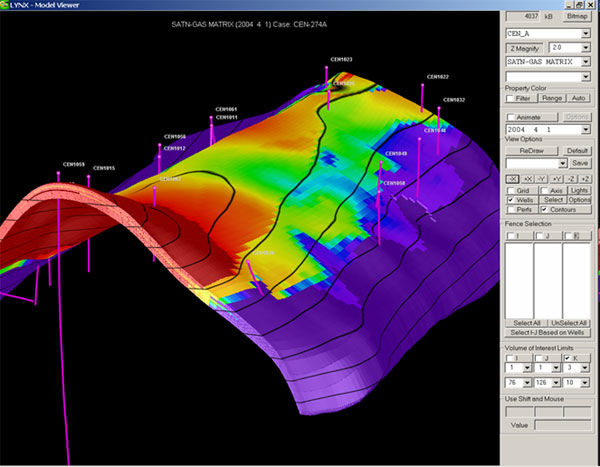
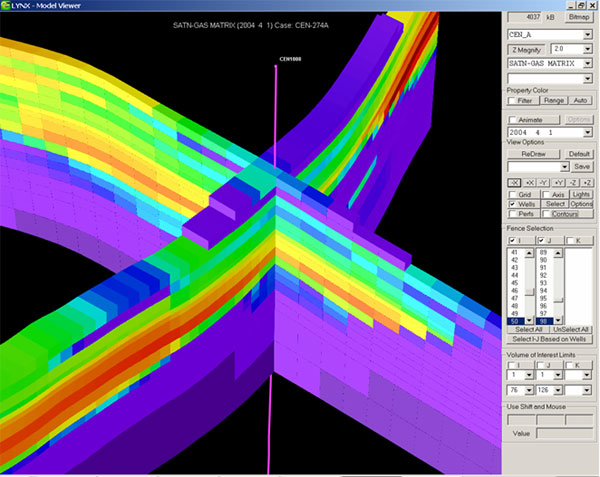
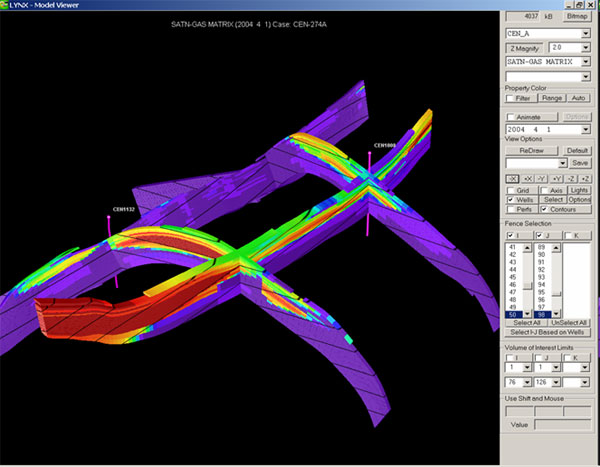
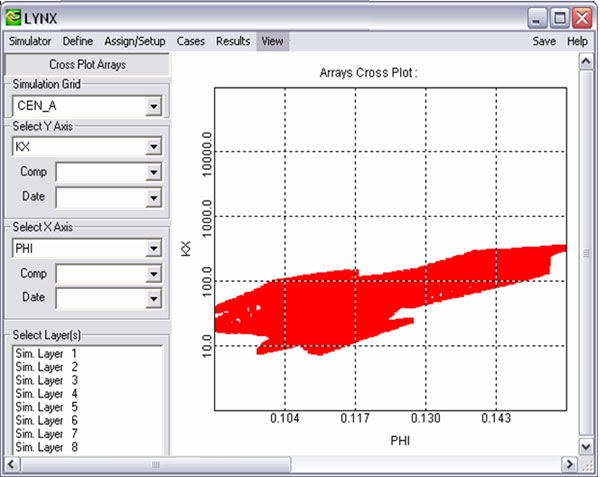
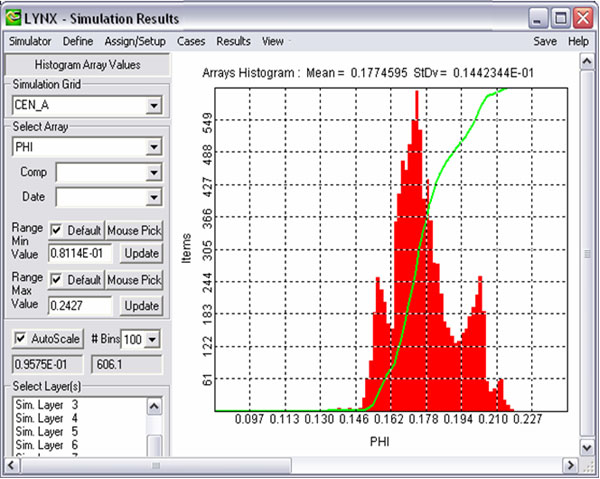
Simulation Post-processing: LYNX displays any initial (porosity, permeability, etc.) or time dependent (saturations, pressures, etc.) array in a 3-D visualization environment. Any property can be displayed with the structural contour lines to enhance visual clarity. Time dependent parameters can be tracked via an array animation facility. In addition to conventional grid-slicing capabilities, LYNX can create grid fence diagrams based on well locations. Upon selection of a specific well, LYNX automatically creates two cross sections along the I and the J locations of the selected well. This well view can be saved as a template for later use. This feature can also be used to create fence diagrams for multiple wells. LYNX provides unique array analysis tools like array cross plots and histograms to review the relationships between arrays and statiustics of the grid properties. These tools aid the engineer to perform consistency checks after each modification made during the history matching process. 3D View of Saturation at a Specific Time Step Fence Diagram forIndividual Well Fence Diagram for Selected Wells Porosity-Perm, Arrays Cross Plot Histogram of Porosity Array |