 |
HM “Mismatch” Analysis |
Capabilities
|
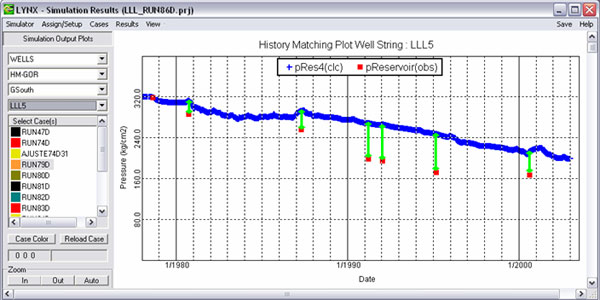
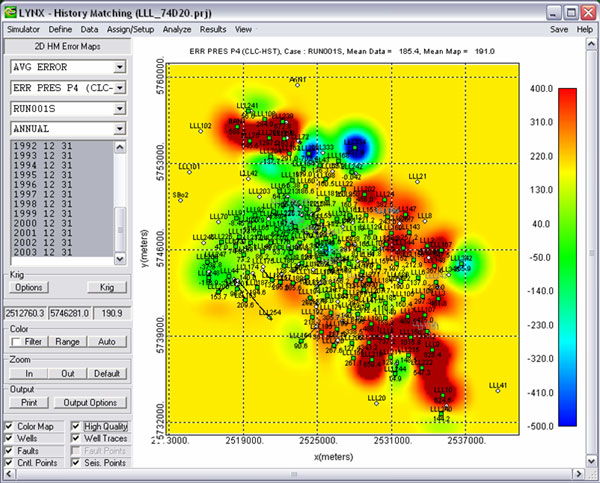
HM “Mismatch” Analysis: LYNX calculates the difference between the simulation results and the observed data for pressure and the production of all three phases for each time step. It also provides a quantitative measure of the mismatch over time or the cumulative/average mismatch within a period of time. These values can be easily mapped allowing a quick identification of the problem areas in the simulation model. This focuses the user on determination of regional property modifications for the next history match run. HM Pressure vs. Time Plot HM Pressure Mismatch Map |